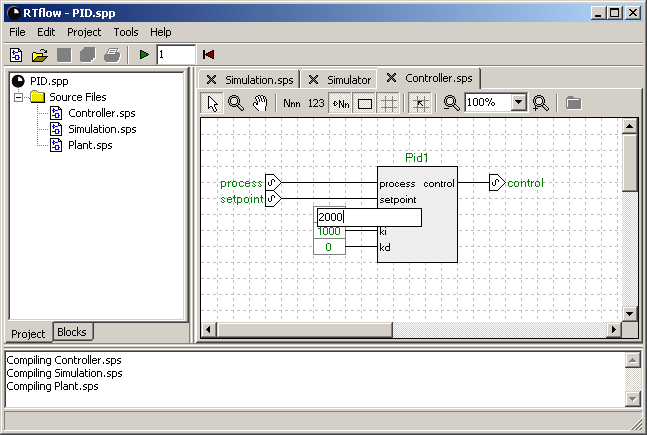
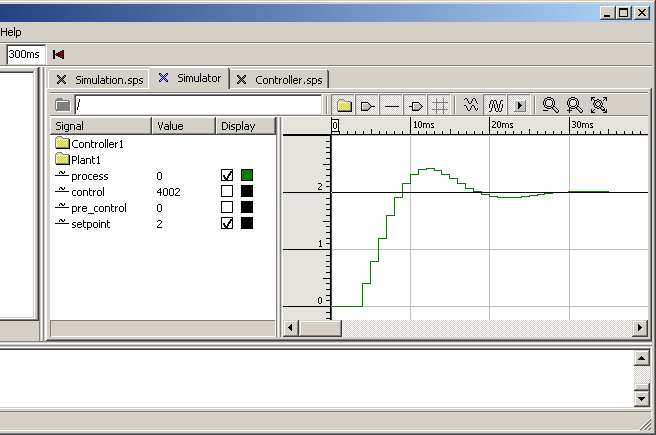
Now that the view is properly set up, we focus our attention on tuning the controller to see if it can perform better. Looking at the results of the simulator, we can see that it takes almost 20 milliseconds to reach a process value over 1.8. This time vill serve as the step response time. Moreover, we can see that after 300 milliseconds, the process value is still not exactly 2, but 2.00763, and very slowly decreasing. Our objective by tuning the controller is to reduce the step response time and to ensure that the process value reaches (and stays at) 2 sooner.

The PID parameters kp, ki and kd can be seen as the inputs to the Pid1 block, and that these values are 1000, 1000 and 0, respectively. To tune the controller, it will suffice to modify these values in this schematic.
If you change the model while the simulation is still running and then invoke the Simulate/Run command (F9), you will be asked if you want to apply the changes and restart the simulation. If you answer Yes, the model will be compiled automatically, and the simulation will restart at time 0. If you answer No, the old simulation will continue without your recent changes. It is not possible to continue the old simulation using the new model.
There are many possibilities for zooming in and out of the graph, so that you can study parts of it at a higher resolution. The Zoom In toolbar button zooms in horizontally around the cursor (the vertical line going through the graph area). The Zoom Out toolbar button zooms out horizontally. By dragging with the mouse inside the graph area, you can create a rectangle into which the graph will zoom when you release the mouse button. Right-clicking in the graph and selecting Zoom Out Vertically in the context menu that appears will zoom out so that the complete vertical extension of all graphs is in view. See the Joint View section for details. Finally, clicking the Restore Zoom toolbar button zooms out both vertically and horizontally so that one pixel corresponds to one cycle.

Keep fine-tuning the controller until you are satisfied. You should be able to achieve a step response time at about 7 milliseconds, while the overshoot is no more than 10% (that is, 2.2). As a hint, try applying a small amount of derivative gain using the kd input of the PID block.